

HTSQualC Quick Start
Goal
HTSQualC is an automated quality control analysis tool for a single and paired-end high-throughput sequencing data (HTS) generated from Illumina sequencing platforms.
Features
- Simultaneously filter and/or trim reads for adapter or primer contamination, uncalled bases (N), and low-quality reads
- Supports single and paired-end reads
- Analyze multiple samples simultaneously
- Parallel computation for accelerating the speed of analysis
- Visualization and statistics
- No dependency on an external open-source tool
Prerequisites
Downloads, access, and services
To complete this tutorial, you will need access to the following services/software
| Prerequisite | Preparation/Notes | Link/Download |
|---|---|---|
| CyVerse account | You will need a CyVerse account to complete this exercise | Register: CyVerse User Portal |
Platform(s)
We will use the following CyVerse platform(s):
| Platform | Interface | Link | Platform Documentation | Quick Start |
|---|---|---|---|---|
| Data Store | GUI/Command line | Data Store | Data Store Manual | Data Store Guide |
| Discovery Environment | Web/Point-and-click | Discovery Environment | DE Manual | Discovery Environment Guide |
Input and example data
To complete this tutorial, you will need to have the following inputs prepared
| Input File(s) | Format | Preparation/Notes | Example Data |
|---|---|---|---|
| HTS generated Sequence reads | FASTQ | Single and Paired-end sequence reads generated from Illumina sequencing platform | Test data for this is available in the Discovery Environment in the Data window under Community Data -> iplantcollaborative -> example_data -> htseqqc |
Get started:
Tip
If you have not already imported your own sequence read files to CyVerse, you can follow the instructions for uploading data, for example using Cyberduck, in our Data Store Guide.
Login to the Discovery Environment.
Click on the Apps in the DE workspace and search for HTSQualC. Click on HTSQualC to open the app or click the button below:

Under “Analysis Name”, you can use default name or change as appropriate.
Under “Input”, provide singe (Input file 1 only) or paired-end (both Input file 1 and 2) data by clicking “Add” button. Here, you can provide single or multiple files for the analysis.
Under “Parameter”, select appropriate parameters to run the analysis. Check below for detailed parameters.
Click Launch Analysis. You will receive a notification and may close the Apps window.
Click on Analyses from the DE workspace and monitor the status of your submitted job (You may have to click refresh to view updated status).
In the Analysis console, once your status appears as ‘Completed,’ click on the name of your analysis to navigate you to the results.
HTSQualC optional parameters:
-a INPUT_FILES_1, --p1 INPUT_FILES_1
                      Single end input files or left files for paired-end
                      data (.fastq, .fq). Multiple sample files must be
                      separated by comma or space
-b INPUT_FILES_2, --p2 INPUT_FILES_2
                      Right files for paired-end data (.fastq, .fq).
                      Multiple files must be separated by comma or space
-c QUAL_FMT, --qfmt QUAL_FMT
                      Quality value format [1= Illumina 1.8, 2= Illumina
                      1.3,3= Sanger]. If quality format not provided, it
                      will automatically detect based on sequence data
-e N_CONT, --nb N_CONT
                      Filter the reads containing given % of uncalled bases
                      (N)
-f ADPT_SEQS, --adp ADPT_SEQS
                      Trim the adapter and truncate the read sequence
                      (multiple adapter sequences must be separated by
                      comma)
-d MIN_SIZE, --msz MIN_SIZE
                      Filter the reads which are lesser than minimum size
-g ADPT_MATCH, --per ADPT_MATCH
                      Truncate the read sequence if it matches to adapter
                      sequence equal or more than given percent (0.0-1.0)
                      [default=0.9]
-i QUAL_THRESH, --qthr QUAL_THRESH
                      Filter the read sequence if average quality of bases
                      in reads is lower than threshold (1-40) [default:20]
-n TRIM_OPT, --trim TRIM_OPT
                      If trim option set to True, the reads with low quality
                      (as defined by option --qthr) will be trimmed instead
                      of discarding [True|False] [default: False]
-p WIND_SIZE, --wsz WIND_SIZE
                      The window size for trimming (5->3) the reads. This
                      option should always set when -trim option is defined
                      [default: 5]
-r MIN_LEN_FILT, --mlk MIN_LEN_FILT
                      Minimum length of the reads to retain after trimming
-q CPU, --cpu CPU     Number of CPU [default:2]
-m OUT_FMT, --ofmt OUT_FMT
                      Output file format (fastq/fasta) [default:fastq]
-v VIS_OPT, --no-vis VIS_OPT
                      No figures will be produced [True|False]
                      [default:False]
--version             show program's version number and exit
Output:
HTSQualC produces the filtered cleaned HTS data as FASTQ/FASTA files, and statistics and visualization of filtered cleaned HTS datasets. The output will be saved in folder with name ending as filtering_out.
Following output files and graphs are produced by HTSQualC with default commands,
| Files | Description |
|---|---|
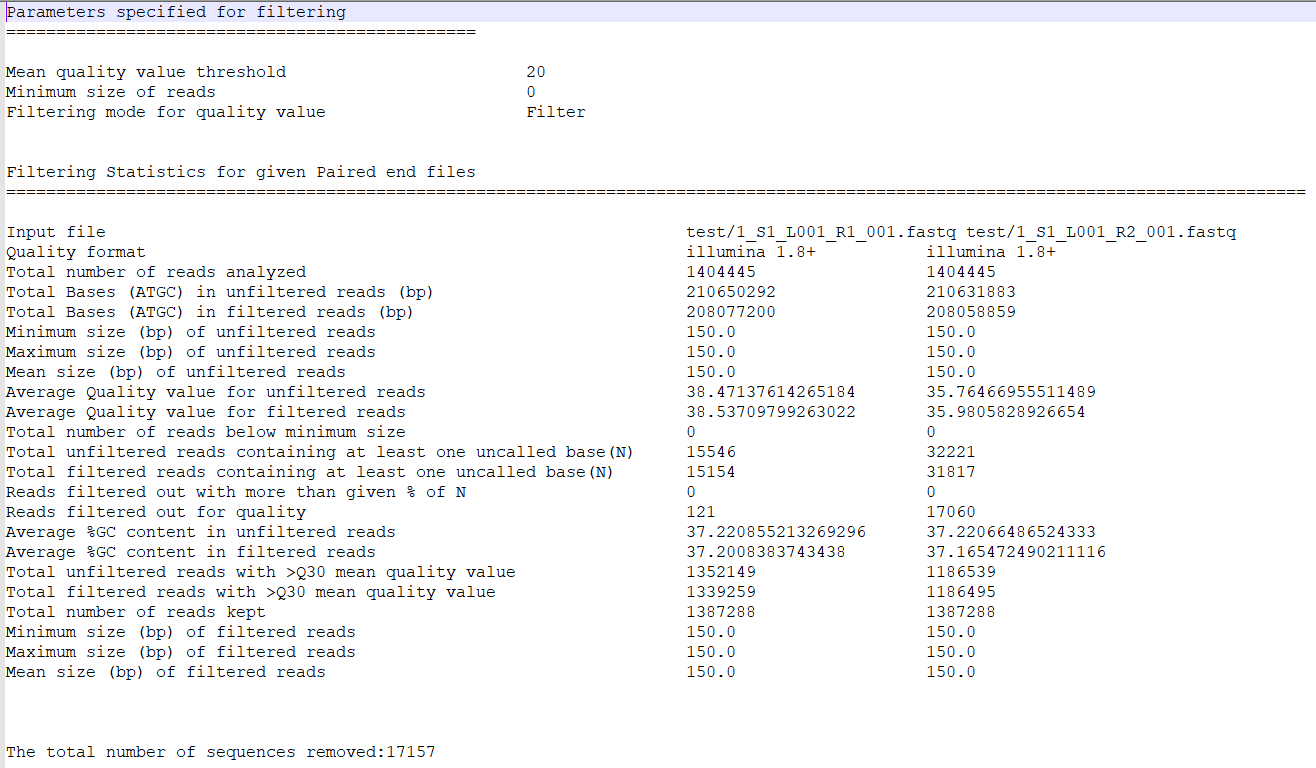
| Statistics.txt | Detailed statistics of quality control evaluations for provided parameters |
| 1_S1_L001_R1_001_Clean.fastq | Cleaned sequence data in FASTQ format (left file for paired-end data) |
| 1_S1_L001_R2_001_Clean.fastq | Cleaned sequence data in FASTQ format (right file for paired-end data) |
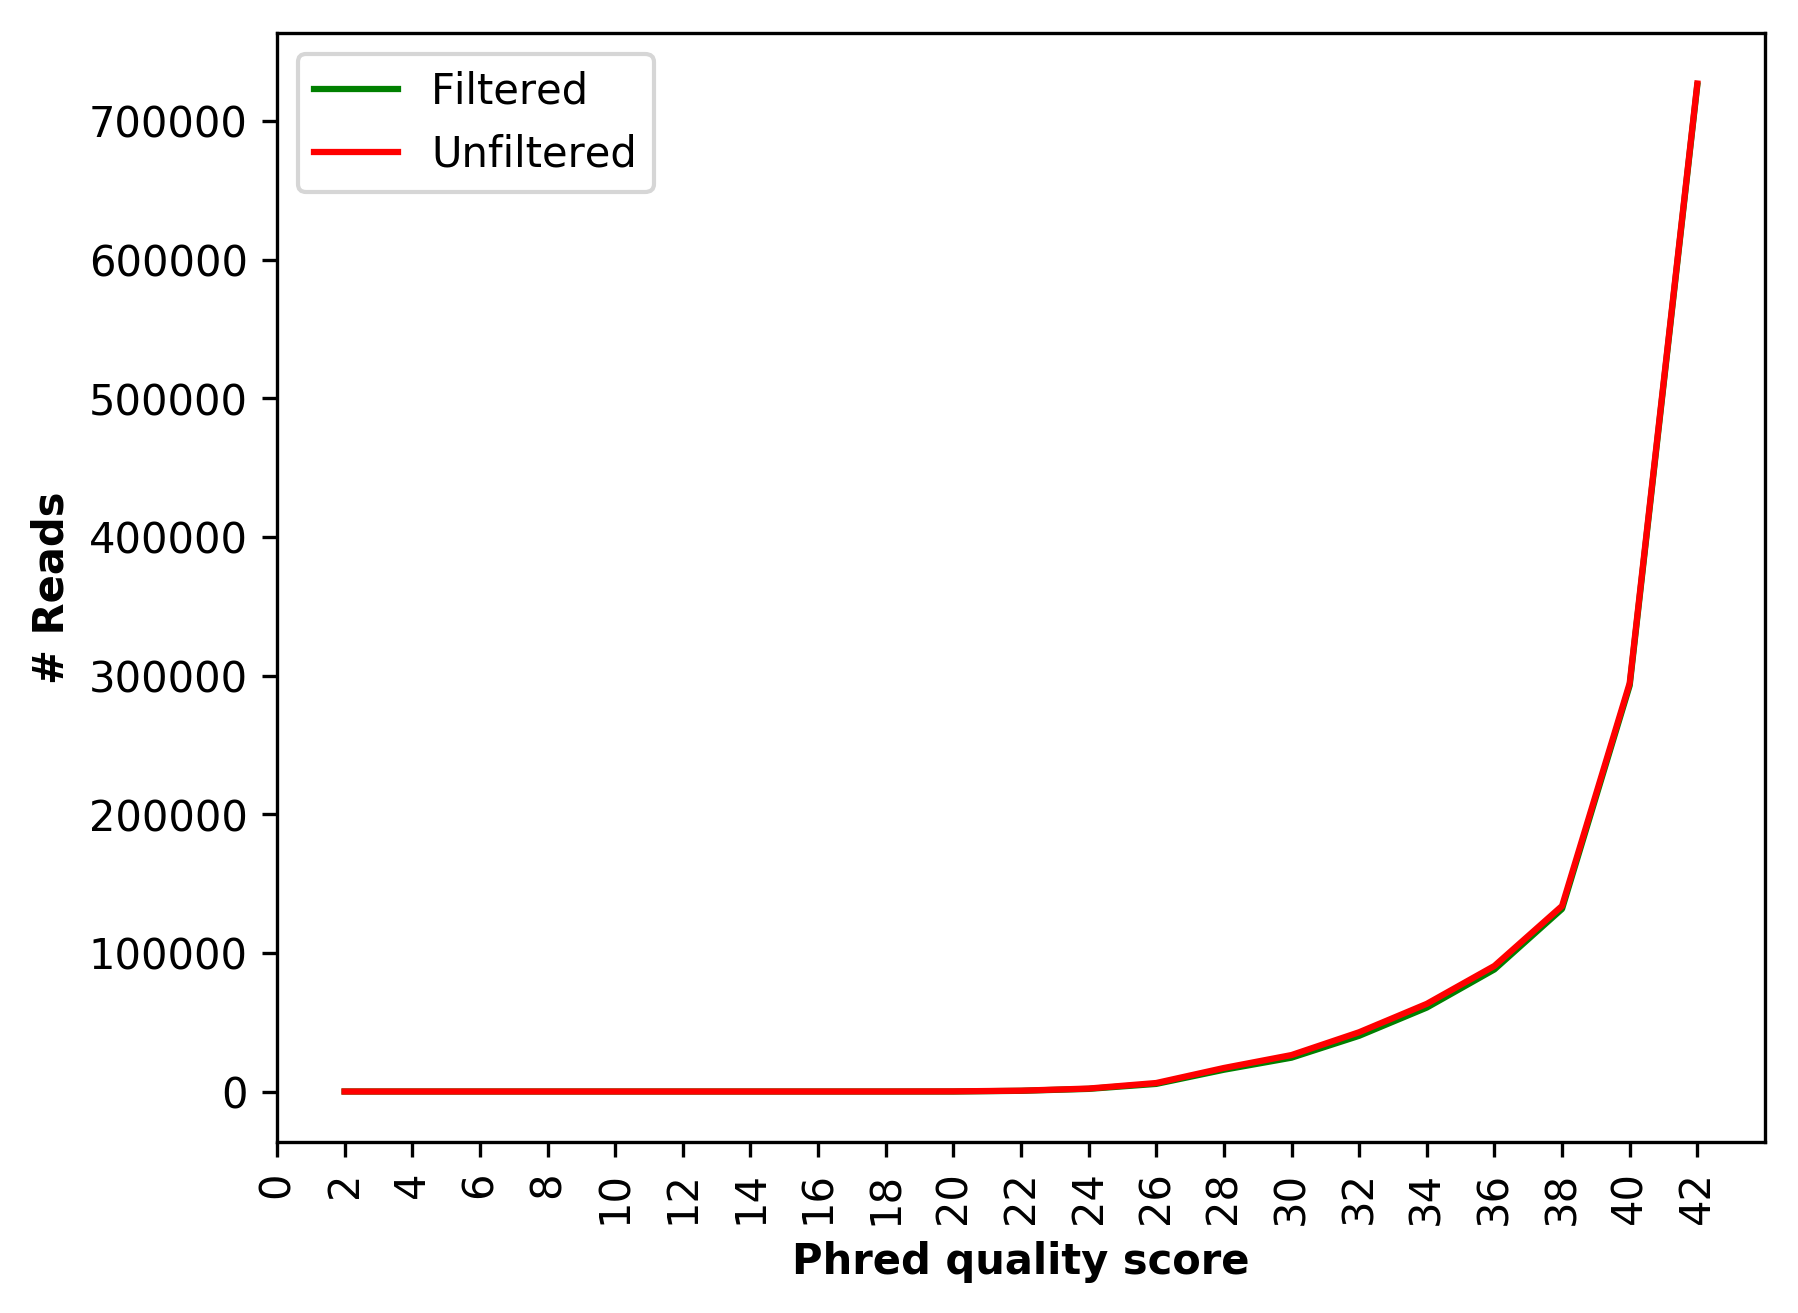
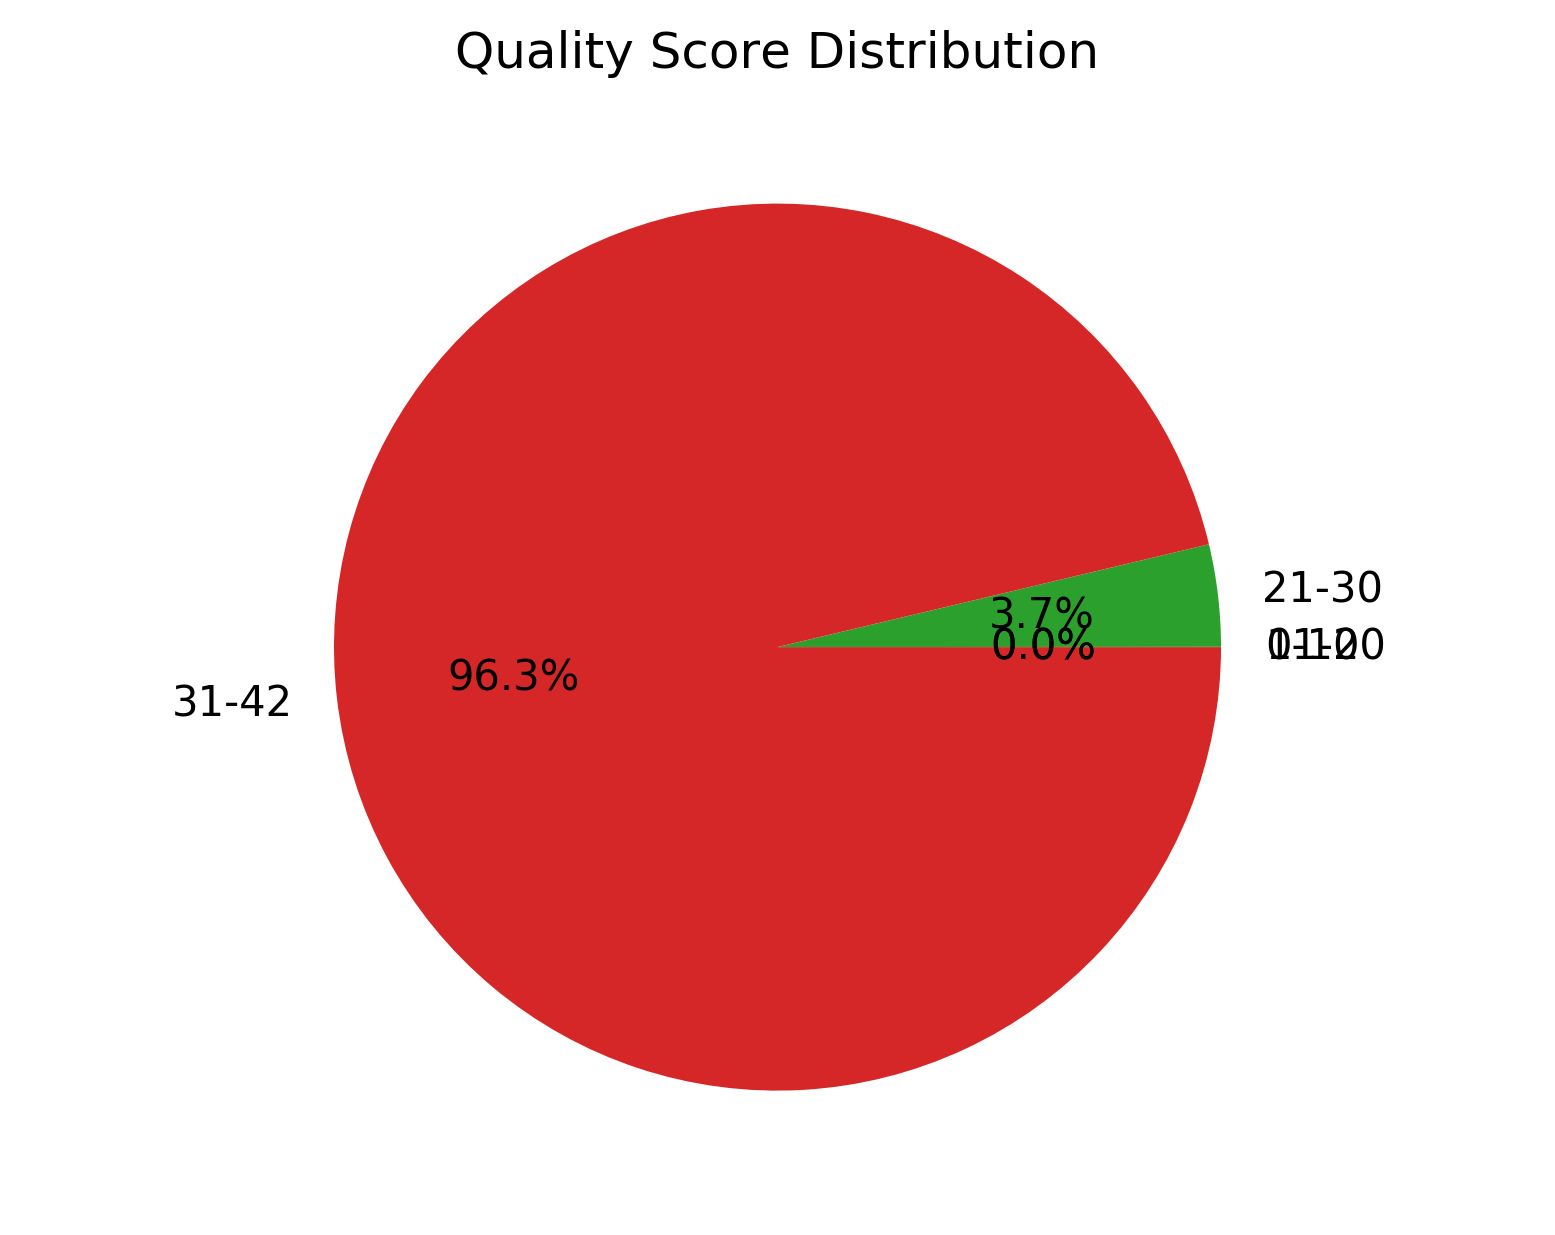
| 1_S1_L001_R1_001_Qualdist.png | Comparative sequence PHRED quality distribution for raw and cleaned data (for left file) |
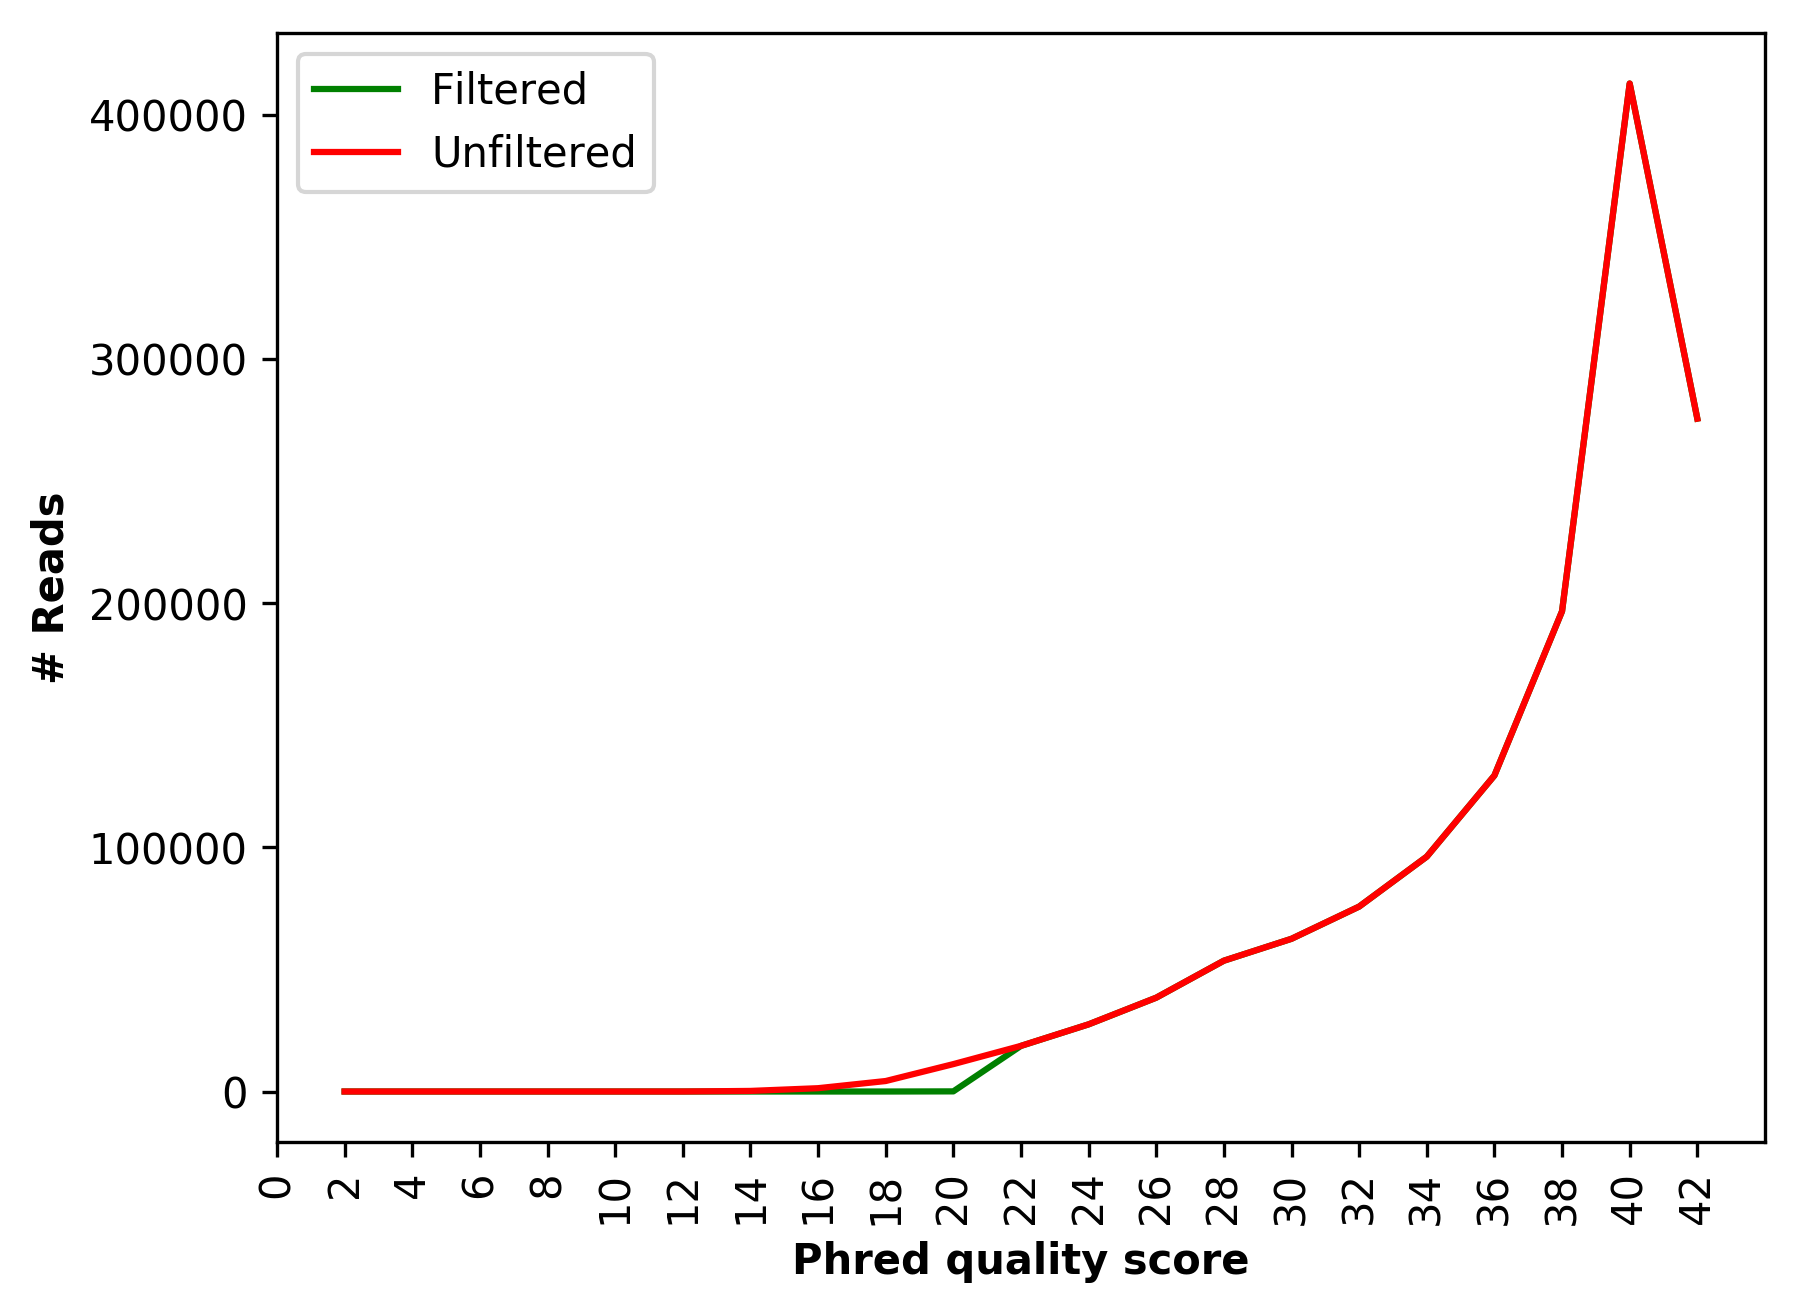
| 1_S1_L001_R2_001_Qualdist.png | Comparative sequence PHRED quality distribution for raw and cleaned data (for right file) |
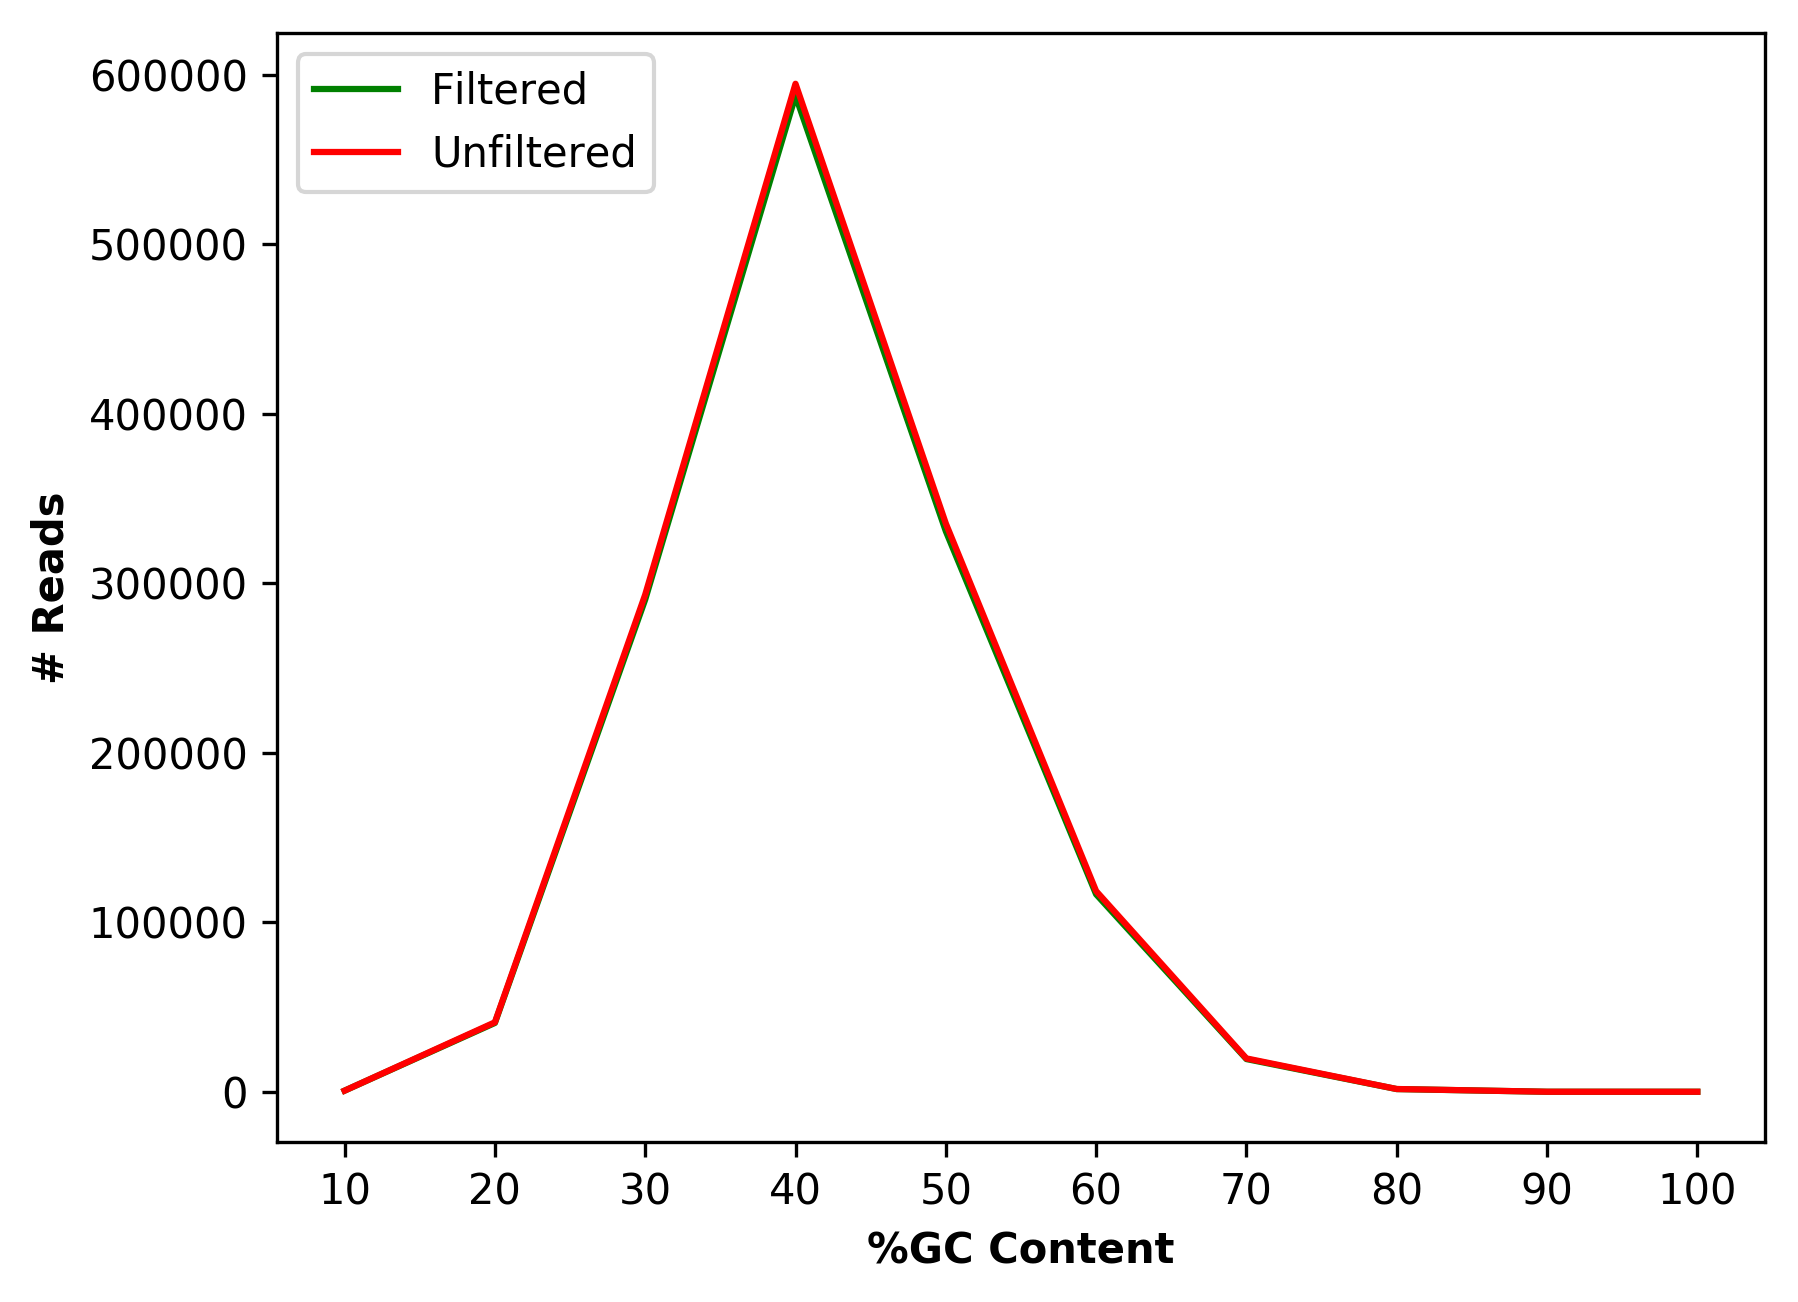
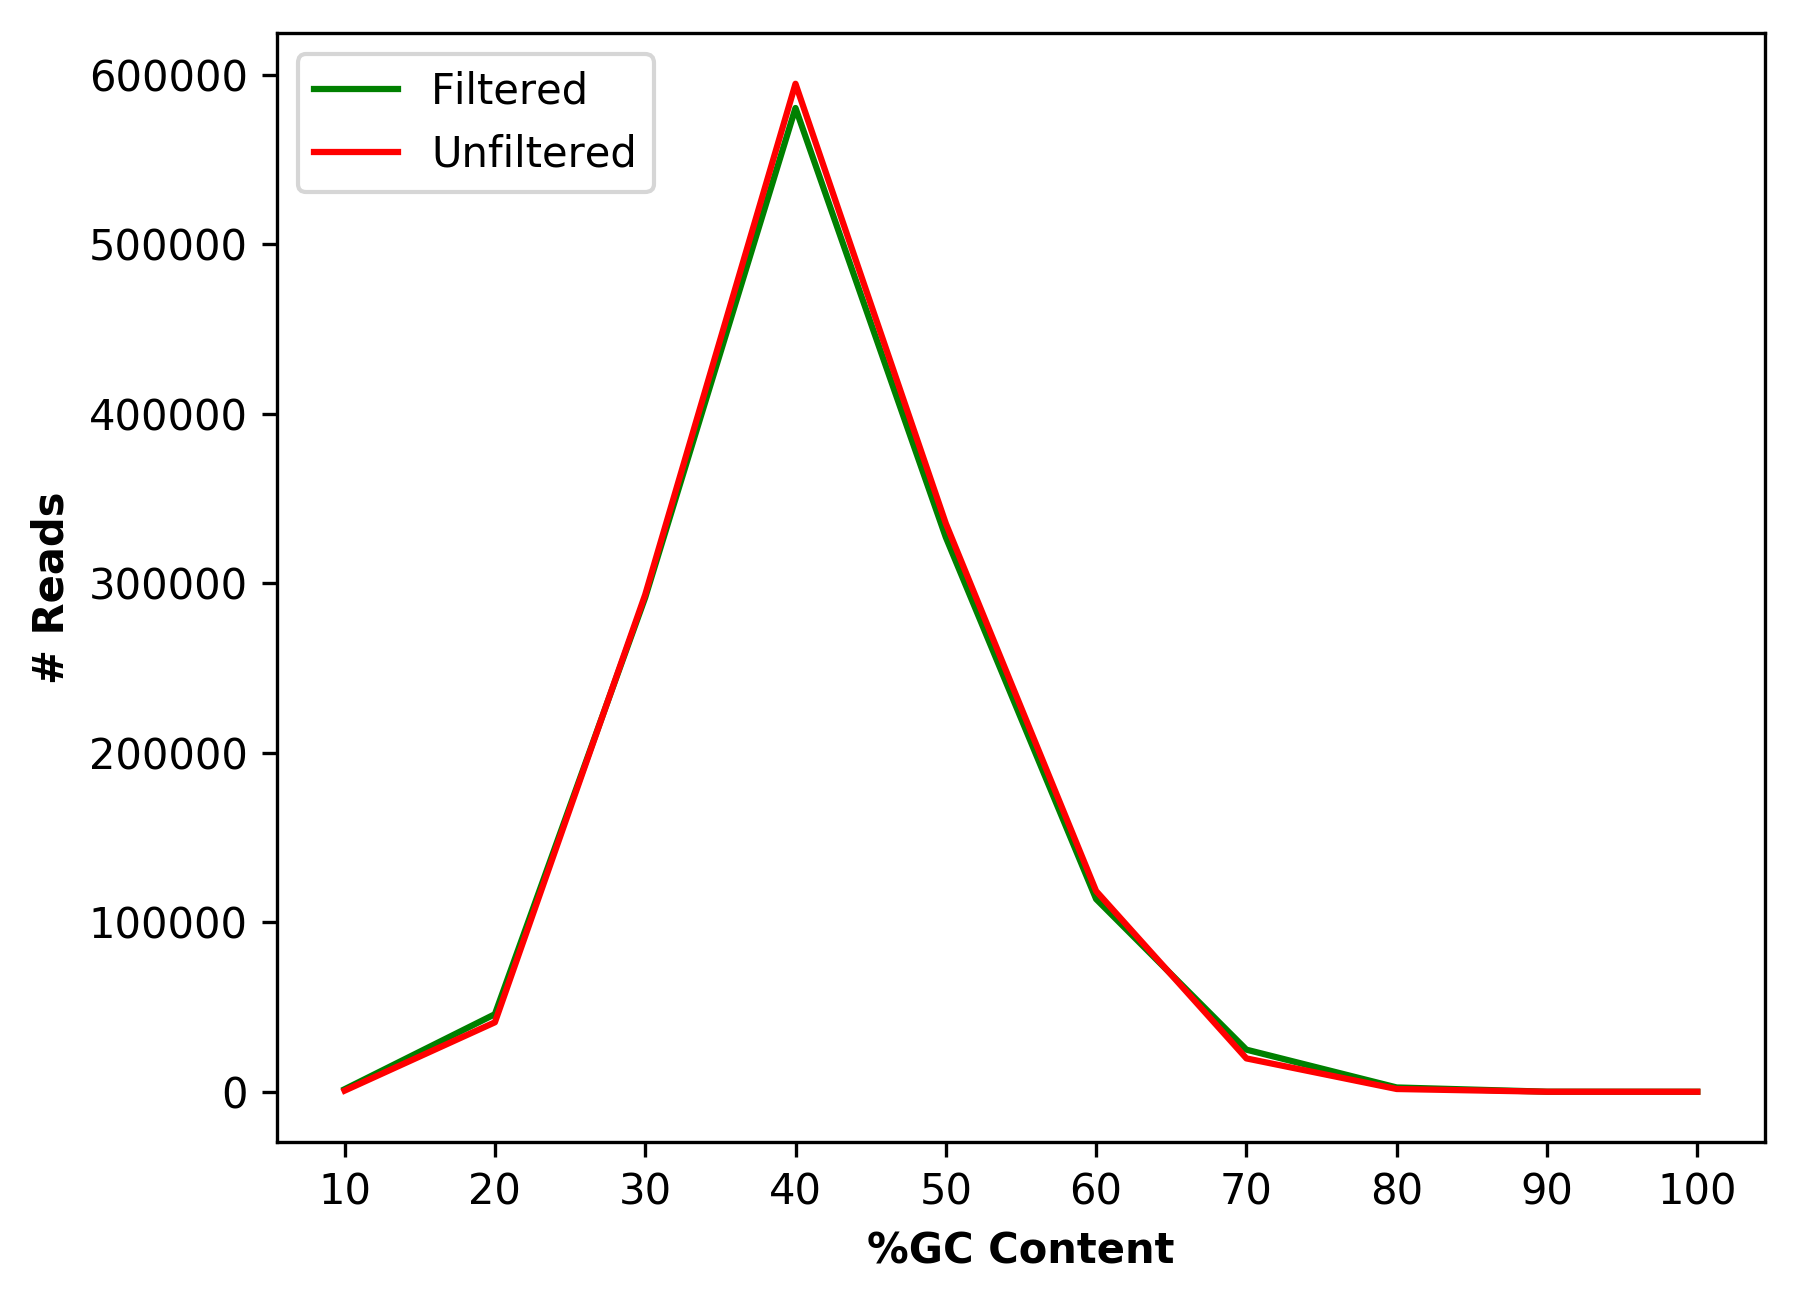
| 1_S1_L001_R1_001_GCdist.png | Comparative percentage of GC content distribution for raw and cleaned data (for left file) |
| 1_S1_L001_R2_001_GCdist.png | Comparative percentage of GC content distribution for raw and cleaned data (for right file) |
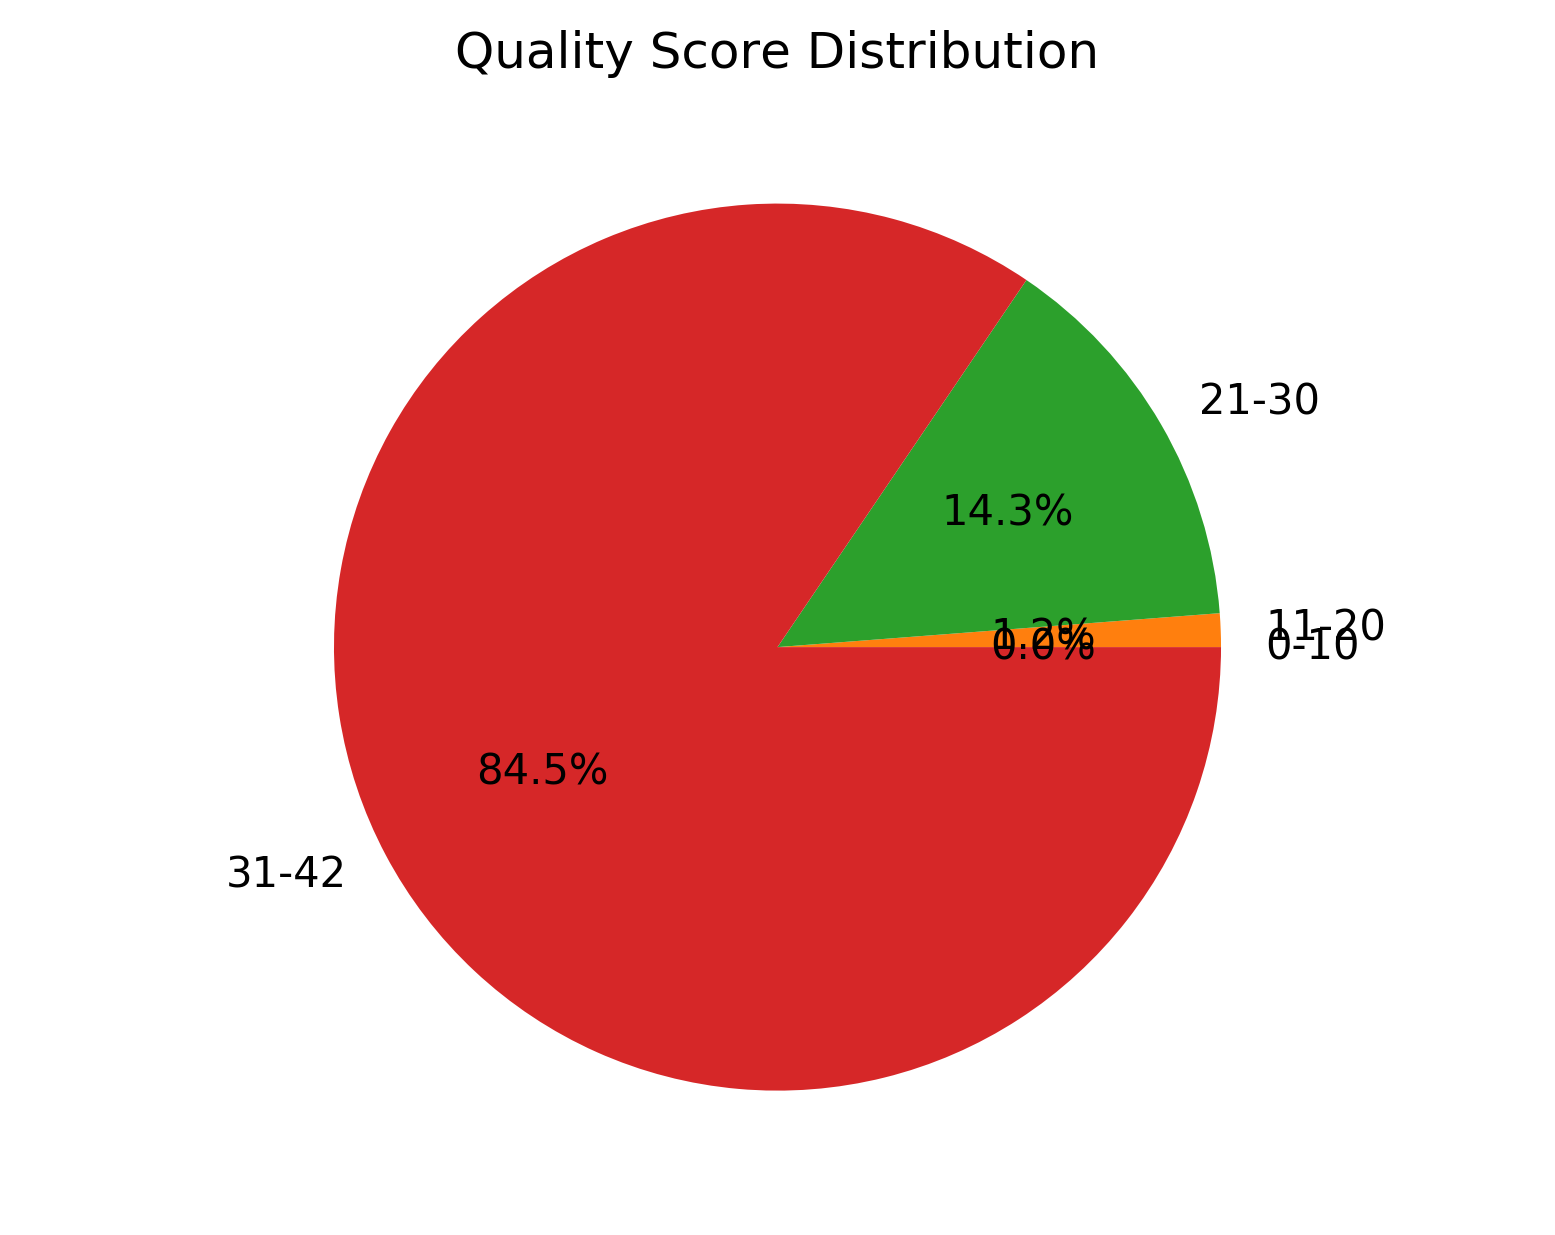
| 1_S1_L001_R1_001_QualGroup.png | Group-wise sequence PHRED quality distribution for cleaned data (for left file) |
| 1_S1_L001_R2_001_QualGroup.png | Group-wise for sequence PHRED quality distribution for cleaned data (for right file) |
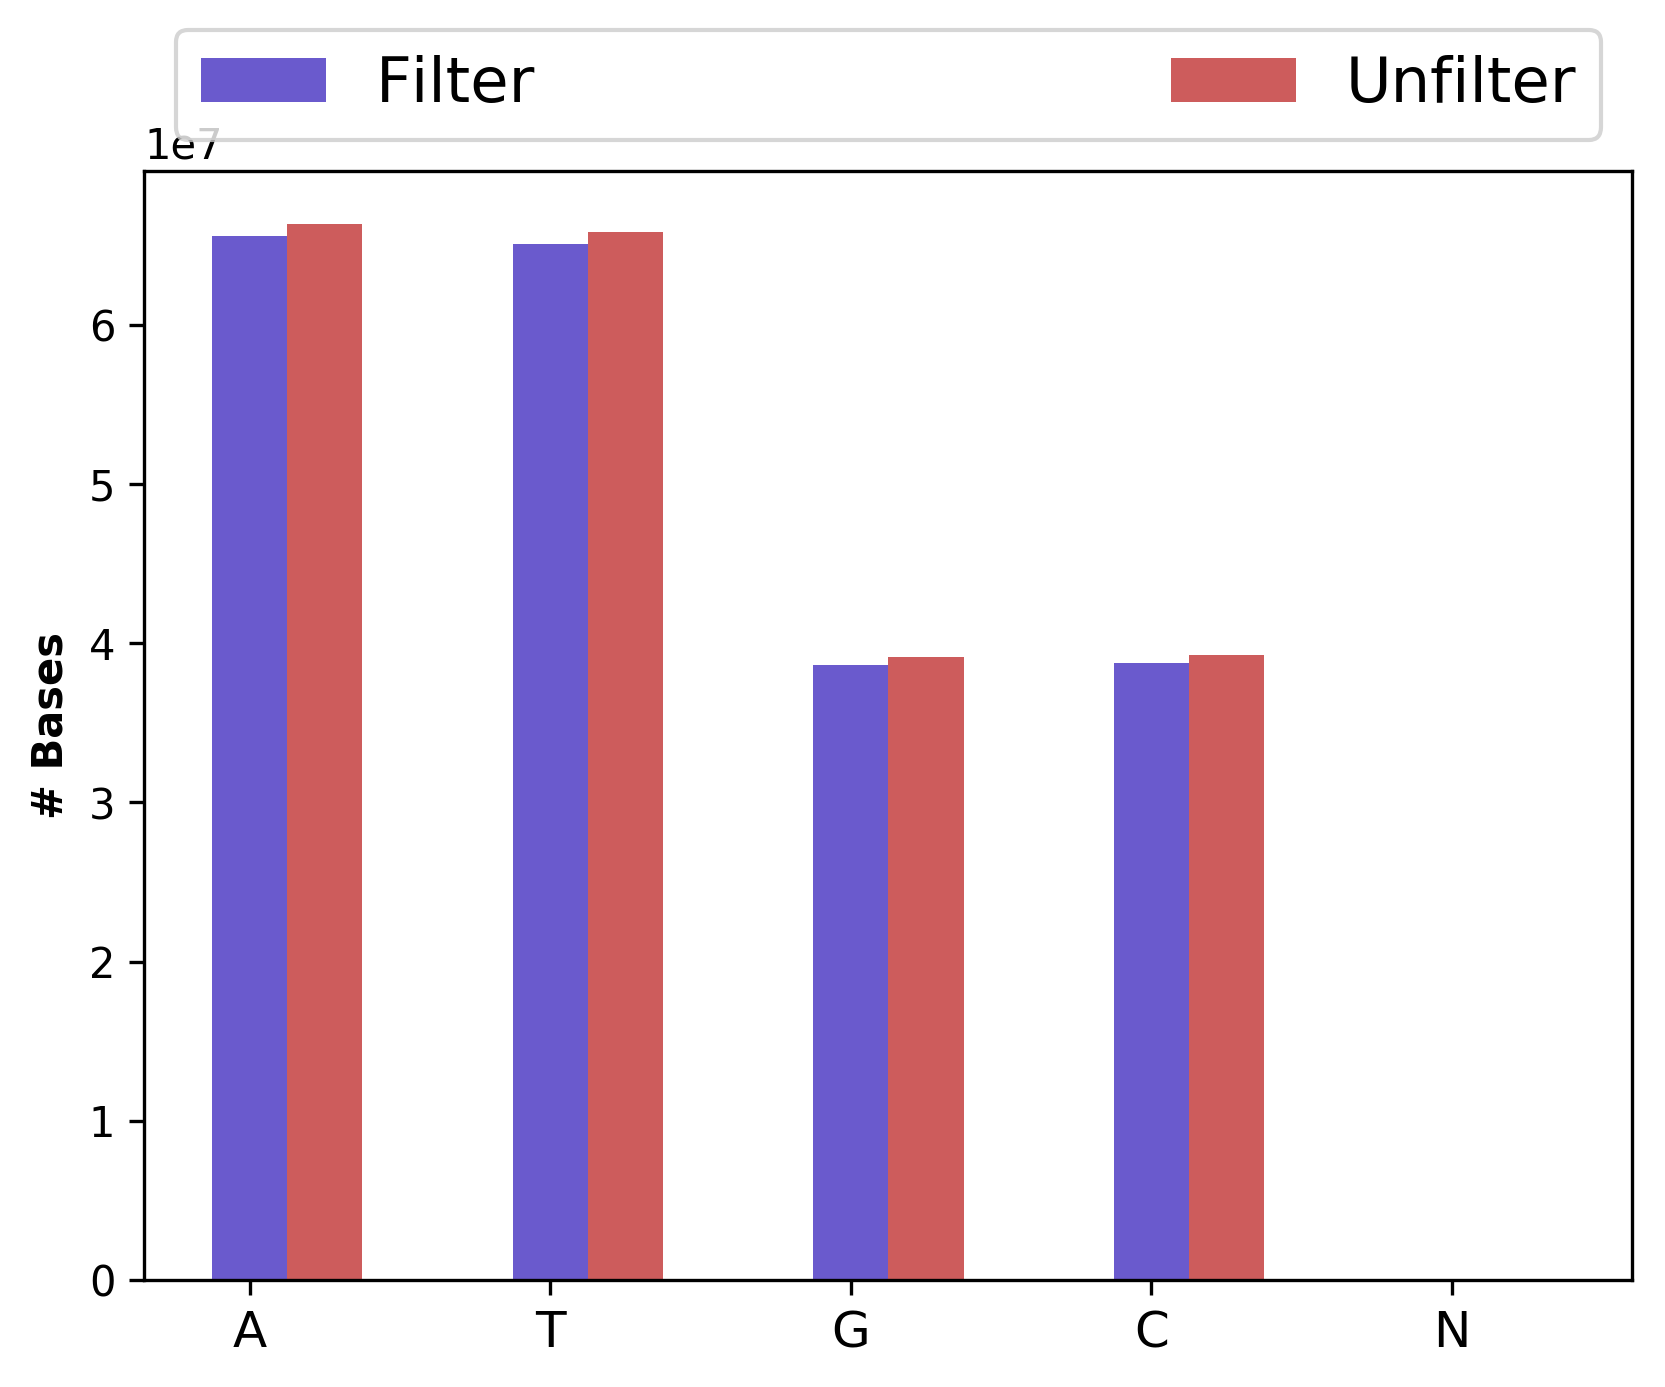
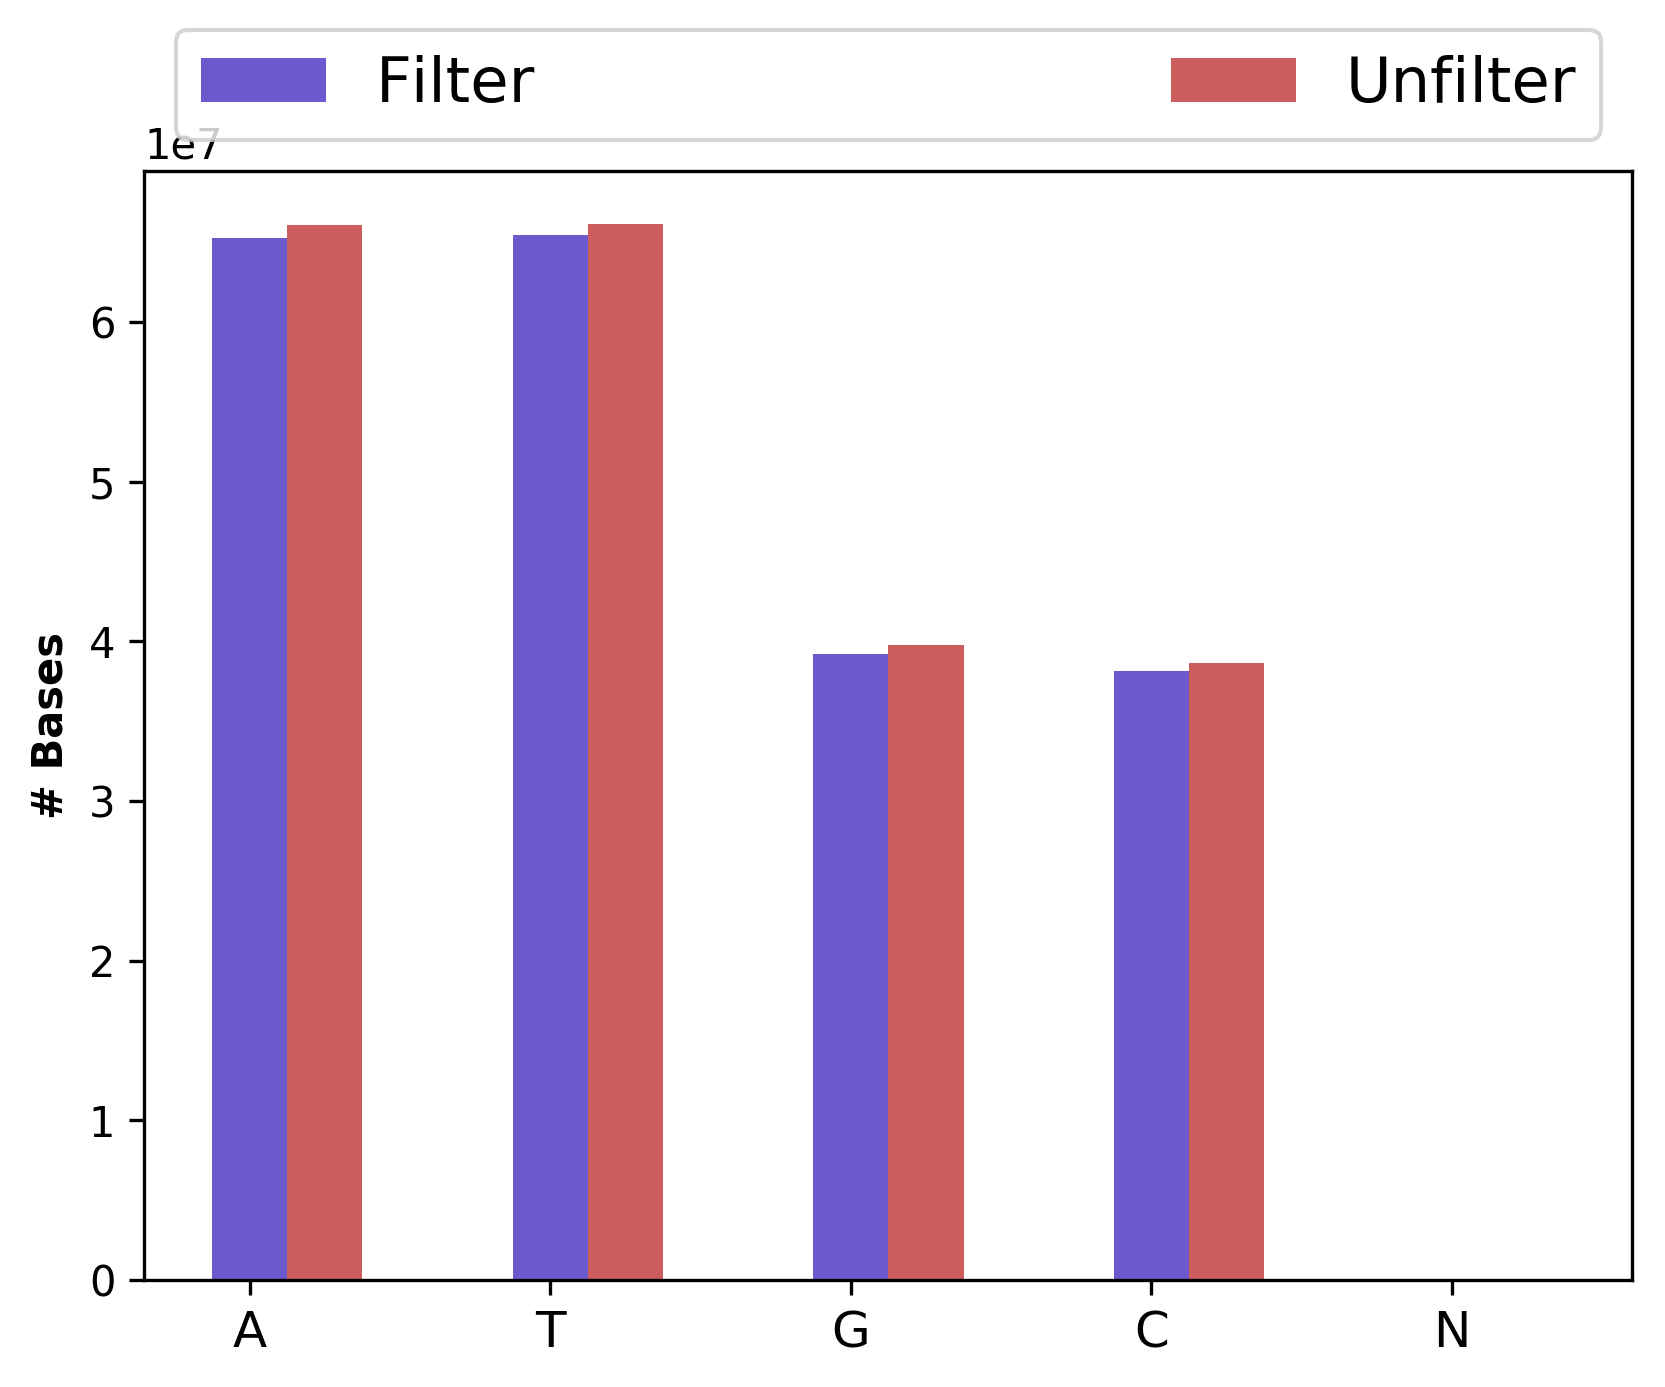
| 1_S1_L001_R1_001_Basedist.png | Nucleotide base content for raw and cleaned data (for left file) |
| 1_S1_L001_R2_001_Basedist.png | Nucleotide base content for raw and cleaned data (for right file) |
| Command.log | Commands used for the HTSQualC analysis |
Detailed statistics of quality control evaluations (Statistics.txt)
Comparative sequence PHRED quality distribution for raw and cleaned data (1_S1_L001_R1_001_Qualdist.png and 1_S1_L001_R2_001_Qualdist.png)
Comparative percentage of GC content distribution for raw and cleaned data (1_S1_L001_R1_001_GCdist.png and 1_S1_L001_R2_001_GCdist.png)
Nucleotide base content for raw and cleaned data (1_S1_L001_R1_001_Basedist.png and 1_S1_L001_R2_001_Basedist.png)
Group-wise sequence PHRED quality distribution for cleaned data (1_S1_L001_R1_001_QualGroup.png and 1_S1_L001_R2_001_QualGroup.png)
If you have any questions, comments or recommendations, please email me at reneshbe@gmail.com
Fix or improve this documentation
- Search for an answer: CyVerse Learning Center
- Ask us for help:
click
 on the lower right-hand side of the page
 - Report an issue or submit a change: Github Repo Link
- Send feedback: Tutorials@CyVerse.org